This guide explains precisely what SIVs are, how their credit spread arbitrage model generated returns, how they were structured, and why the risks they carried were so badly misunderstood — by investors, regulators, and the sponsoring banks themselves.
Key Takeaways
- SIVs are non-bank entities that profit by borrowing short-term (via commercial paper) and investing in longer-term, higher-yielding structured assets
- Their core vulnerability: short-term liabilities funding long-term illiquid assets, creating a permanent maturity mismatch
- At peak in mid-2007, approximately 34–36 SIVs held nearly $400 billion in assets; all had collapsed by October 2008
- Unlike SPVs, SIVs are permanently capitalized, actively managed, and profit solely from credit spread arbitrage
- AAA ratings on SIV-issued commercial paper reflected the liability structure, not the quality of underlying assets
What Is a Structured Investment Vehicle (SIV)?
A Structured Investment Vehicle is a non-bank financial entity established to earn the credit spread between higher-yielding long-term assets it holds and the lower-cost short-term liabilities it issues. Legally and operationally separate from both funds and banks, it occupies its own category within the structured finance ecosystem.
Functionally, SIVs acted as financial conduits, channeling capital from short-term money markets into long-term structured products: mortgage-backed securities (MBS), asset-backed securities (ABS), and collateralized debt obligations (CDOs).
Why Offshore, and Why Off-Balance-Sheet?
SIVs were typically incorporated in offshore jurisdictions — Jersey, the Cayman Islands, and Ireland were common choices. According to the BIS, these locations were selected for tax neutrality, legal clarity, and ease of incorporation. The offshore structure also reduced the regulatory burden compared to operating as a regulated bank.
SIVs were also held off the balance sheets of their sponsoring banks. Their assets and liabilities didn't directly affect the parent institution's capital ratios. That design feature proved deeply problematic when stress arrived: sponsors faced intense reputational pressure to rescue vehicles they had no legal obligation to support.
SIVs vs. Other Structured Vehicles
SIVs are distinct from asset-backed securities and CDOs in one critical way: they are permanently capitalized with active professional management teams making ongoing investment decisions. Unlike those static structures, an SIV's portfolio evolves continuously.
One notable terminology point: S&P's own 2002 methodology used both "structured investment vehicle" and "limited-purpose investment company" (LIPIC) interchangeably — the two terms describe the same structure, not agency-specific variations as the terminology is occasionally misread.
Unlike multi-seller ABCP conduits, SIVs were required to mark their assets to market — daily under S&P's criteria — a transparency feature that, during market stress, became a mechanism for accelerating collapse.
How SIVs Work: The Credit Spread Mechanics
The core business model is straightforward in theory: borrow cheap in the short-term money market, invest in longer-term assets paying higher yields, keep the spread.
In practice, SIVs issued commercial paper (CP) to fund purchases of structured finance assets. When the CP matured, they issued new CP to repay the old — a process called "rolling over." Under normal conditions, this process works indefinitely — the SIV never needs to sell its long-term assets, only keep rolling its short-term funding.
The Two Transformations That Generate (and Destroy) Value
IMF research on structured finance documents two core transformations SIVs performed simultaneously:
- Maturity transformation — borrowing short while investing long, capturing the yield differential between short and long-dated instruments
- Credit transformation — senior SIV liabilities were rated AAA/A-1+ by S&P, while the underlying asset portfolio extended from AAA down through BBB+ ratings, capturing additional spread from holding lower-rated paper
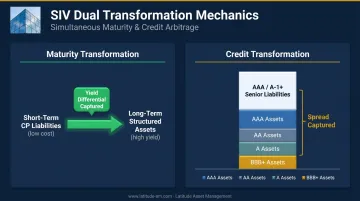
These two transformations explain both the profit and the structural fragility. The spread is genuine — but it only holds as long as short-term funding remains available to roll.
Leverage: The Amplifier
Average SIV leverage was approximately 14 times capital, according to IMF data — a meaningful amplifier of both returns and losses. The leverage ratio meant that a relatively small decline in asset values could wipe out a vehicle's entire capital base.
AAA ratings on senior liabilities were non-negotiable — without them, SIVs couldn't access short-term funding at competitive rates. S&P's rating criteria covered:
- Portfolio credit quality and capital adequacy under immediate wind-down scenarios
- Daily liquidity tests and asset-price sensitivity
- Yield-curve stress and foreign exchange stress
- Counterparty exposure limits
Critically, the rating reflected the liability structure — not the quality of the underlying asset portfolio.
The Capital Structure of a Typical SIV
SIVs typically issued two tiers of debt:
| Tier | Description | Typical Rating |
|---|---|---|
| Senior debt | Mix of commercial paper and medium-term notes (MTNs) | AAA/Aaa; short-term A-1/P-1 |
| Capital notes | Subordinated, first-loss layer; 6–10% of assets | Subordinated; served as credit enhancement for senior debt |
Average leverage: approximately 14x capital.
That leverage rested on a portfolio far more varied than the "70–80% high-grade assets" shorthand suggests. October 2007 IMF data on SIV asset composition shows what managers were actually holding:
What SIVs Actually Held
- 28.0% financial institution debt
- 13.3% prime RMBS
- 8.3% subprime RMBS
- 6.7% Alt-A RMBS
- 7.7% CMBS
- 12.1% ABS (auto, student loans, credit cards)
- 15.4% CDOs
- 6.3% CLOs
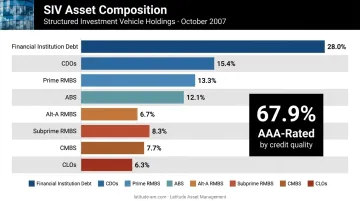
By credit rating: 67.9% was AAA-rated, with the remainder spread across AA+, AA, AA-, A+, A, A-, and down to BBB+. The portfolio wasn't as uniformly high-grade as commonly described.
The Mark-to-Market Trap
S&P required SIV managers to mark assets and hedges to market daily. This transparency measure had a lethal side effect during stress: falling market prices immediately triggered capital and liquidity tests. As the BIS has documented, trigger breaches could force asset sales, which depressed prices further, creating a feedback loop from liquidity stress into solvency crisis.
Backstop liquidity facilities from sponsoring banks covered only 10–15% of the face value of senior funding outstanding. That was sufficient to support the rating in normal conditions, but wholly inadequate once a real funding crisis hit.
SIV vs. Special Purpose Vehicle (SPV): Key Differences
An SPV (or Special Purpose Entity) is the broader category: a bankruptcy-remote legal entity created to isolate financial risk, used across securitizations, project finance, and asset transfers. SIVs are a specific type of SPV — but with important distinctions.
| Feature | General SPV | SIV |
|---|---|---|
| Capitalization | Often single-transaction | Permanent |
| Management | Typically passive/static | Active, ongoing |
| Funding | Various (equity, bonds, CP) | Primarily continuous CP issuance |
| Profit motive | Transaction-specific | Ongoing credit spread arbitrage |
| Asset portfolio | Usually fixed at inception | Actively managed and evolving |
One distinction with real consequences: while both structures can be off-balance-sheet for the sponsor, SIVs carried significant implicit reputational risk. A major bank associated with a collapsing SIV faced intense market pressure to rescue investors — regardless of any legal obligation. No one priced that implicit guarantee into the structure.
The Rise and Fall of SIVs: History and the 2008 Crisis
The SIV concept originated at Citibank in 1988, created by Nicholas Sossidis and Stephen Partridge-Hicks. The structure was designed for investors who wanted highly rated vehicles offering more stable returns than volatile money markets.
Growth was gradual at first, then explosive. By July 2007, approximately 34–36 SIVs held nearly $400 billion in assets under management. That scale meant the structural vulnerabilities embedded in SIVs — short-term funding against long-term assets — would have outsized consequences when markets seized.
The Collapse Sequence
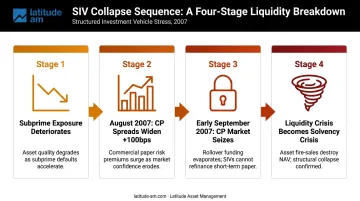
The crisis moved through four distinct stages, each accelerating the next:
- Subprime exposure deteriorates: Some SIVs held concentrated positions in U.S. subprime MBS. Housing prices declined faster than models predicted, destroying asset values
- August 2007: CP spreads widen: BIS data shows spreads widened by as much as 100 basis points in a single month
- Early September 2007: CP market seizes: The commercial paper market became nearly completely illiquid, including for SIVs with minimal subprime exposure and no observed collateral losses
- Liquidity crisis becomes solvency crisis: Forced asset sales into collapsing markets drove prices down further, triggering capital tests and accelerating the spiral
Two case studies mark the sector's endpoint. Cheyne Finance, a roughly $7 billion vehicle, entered receivership in 2007; creditors who chose cash ultimately recovered around 61% of face value.
Sigma Finance, a $27 billion Gordian Knot vehicle, was the last surviving SIV when it entered receivership on October 1, 2008, marking the end of the sector.
Key Risks and Lessons from the SIV Collapse
The SIV episode produced three interconnected risk categories that any investor in complex structured vehicles should understand:
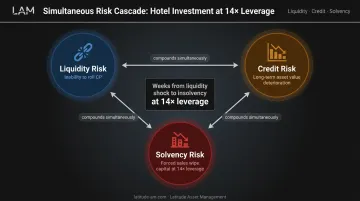
- Liquidity risk — The inability to roll over short-term CP when investors lose confidence, regardless of underlying asset quality
- Credit risk — Deterioration in long-term asset values, reducing capital headroom
- Solvency risk — When forced asset sales push portfolio values below outstanding liabilities, leverage magnifying every dollar of loss
These risks don't operate in sequence — they compound simultaneously. A liquidity shock becomes a solvency crisis within weeks when leverage is 14x and daily mark-to-market requirements force sales into illiquid markets.
The Most Dangerous Misconception
Many institutional investors — including municipal entities — held SIV-issued commercial paper as a cash-like, low-risk instrument. The AAA rating on the CP was real. But it reflected the SIV's liability structure, not the safety of the underlying assets. Investors had little visibility into whether their paper was backed by prime RMBS or subprime CDOs.
The GFOA has noted that SIV commercial paper carries additional credit and liquidity risk beyond what its short-term rating implies. That distinction was invisible to most buyers until it wasn't.
That opacity problem extended well beyond individual investors. Sponsoring banks faced reputational pressure to rescue SIVs they had structured specifically to be off-balance-sheet — a systemic failure of transparency that regulators, rating agencies, and institutional investors all shared responsibility for missing.
Post-crisis, FAS 167/ASC 810 and Basel III raised the capital and accounting costs of off-balance-sheet structures significantly. But the traditional SIV model had already ended before those rules took effect — Sigma's receivership in October 2008 closed the sector before regulation could.
For investors evaluating any complex structured vehicle today — whether in capital markets, real estate, or hospitality — the SIV episode reinforces one enduring principle: structure complexity creates opacity, opacity conceals risk, and concealed risk surfaces when markets are least able to absorb it.
Identifying structural vulnerabilities before they become capital events requires advisors who treat capital stack design and scenario analysis as risk management tools, not administrative exercises. That institutional discipline is central to how Latitude Asset Management approaches hotel investment structures across the Americas.
Frequently Asked Questions
What is a structured investment vehicle?
A Structured Investment Vehicle is a non-bank financial entity that borrows short-term through commercial paper and invests in longer-term structured assets to earn the credit spread between them. SIVs are permanently capitalized and actively managed, distinguishing them from single-transaction structured vehicles.
What is an example of a structured investment vehicle?
Cheyne Finance is a well-documented example: a traditional SIV of approximately $7 billion that entered receivership in 2007 following market-value and funding stress, with cash-electing creditors recovering around 61% of face value. Sigma Finance, a $27 billion vehicle, was the last surviving SIV before entering receivership on October 1, 2008.
How did SIVs contribute to the 2008 financial crisis?
SIVs held significant subprime MBS exposure while depending entirely on short-term commercial paper to fund those positions. When CP markets seized in late 2007, SIVs could not roll over funding and were forced to sell illiquid assets into collapsing markets, accelerating broader credit contraction and contributing to the systemic crisis.
What is the difference between an SIV and an SPV?
An SPV is a broad category of bankruptcy-remote legal entities used to isolate financial risk. An SIV is a specific type of SPV that is permanently capitalized, actively managed, and profits solely from ongoing credit spread arbitrage through continuous commercial paper issuance — rather than serving a single transaction purpose.
Are structured investment vehicles still used today?
Traditional SIVs in their original form ceased to exist by October 2008. Post-crisis regulatory changes — including FAS 167/ASC 810 and Basel III's leverage and liquidity requirements — substantially increased the capital costs of off-balance-sheet structures, making the original SIV model economically non-viable even if it had survived the crisis itself.
What assets did SIVs typically invest in?
By October 2007, SIV portfolios included financial institution debt (28%), prime and subprime RMBS, CMBS, ABS, CDOs, and CLOs. Approximately 67.9% was AAA-rated, with the remainder in AA and A-rated tranches — a more heterogeneous mix than the "safe high-grade assets" narrative CP investors generally assumed.