Introduction
Hotel investment financial models are built on assumptions — occupancy targets, ADR projections, cost structures, and financing terms. Even modest deviations from those assumptions can upend projected returns. A 5-point drop in occupancy doesn't just reduce revenue; it compresses margins, strains debt service, and can flip an equity-positive deal into a cash-consuming one.
STR data shows how severe this can be: U.S. hotels in 2020 saw occupancy fall to 44.0% (down 33.3%), ADR drop to $103.25 (down 21.3%), and RevPAR collapse by 47.5% to $45.48. Even a conventional recession — 2009 — pushed national RevPAR down 16.7%.
Sensitivity analysis stress-tests those assumptions before capital is committed. It reveals which variables carry the most risk and gives investors a quantified view of downside exposure, converting a financial model from a static projection into a decision-support tool.
This guide covers what sensitivity analysis is, why it matters for hotel investment decisions, how to build it step by step, and how to translate its outputs into real operational triggers.
Key Takeaways
- Sensitivity analysis changes one input variable at a time to measure its isolated effect on a target output like IRR or DSCR
- It differs from scenario analysis, which shifts multiple variables simultaneously to model a holistic situation
- The highest-impact variables in hotel models are typically occupancy rate, ADR, GOP margin, and debt service terms
- Running sensitivity analysis before a capital raise signals credibility and risk awareness to investors
- Sensitivity outputs should directly inform management KPIs, warning thresholds, and contingency triggers
What Is Sensitivity Analysis in a Startup Financial Model?
Sensitivity analysis — sometimes called "what-if analysis" — is a financial modeling technique that changes one input variable at a time while holding all others constant. The goal is to measure how that single change affects a key output: IRR, net cash flow, equity multiple, or DSCR.
In a hotel investment context, sensitivity analysis appears at every major decision point:
- Pre-acquisition underwriting — validating return assumptions before closing
- Pre-opening financial modeling — stress-testing ramp-up timelines
- Investor pitch preparation — demonstrating risk awareness to capital partners
- Ongoing asset management — monitoring whether actual performance tracks within acceptable ranges
- Lender due diligence — demonstrating debt service resilience under stress
Sensitivity Analysis vs. Scenario Analysis
These two techniques are related but distinct — and both belong in a rigorous hotel financial model.
| Sensitivity Analysis | Scenario Analysis | |
|---|---|---|
| Mechanism | Changes one variable at a time | Changes a bundled set of variables simultaneously |
| Example | What happens to IRR if occupancy drops 5 points? | What happens in a recession where demand falls, costs rise, and financing tightens? |
| Best use | Identifying which driver creates the most risk | Modeling coherent real-world situations |
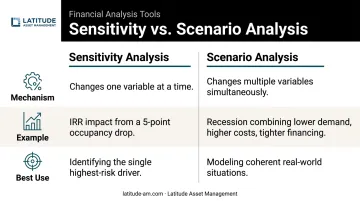
The CFA Institute's financial analysis framework treats these as complementary tools — sensitivity isolates individual driver impact, while scenario analysis tests integrated outcomes. Use both.
Why Sensitivity Analysis Is Critical for Hotel Investment Decisions
Hotels are operationally intensive and revenue-volatile. Occupancy and ADR can swing sharply based on seasonality, new supply, local demand shocks, or macroeconomic conditions. The 2009 recession pushed full-service hotel occupancy down to 62.5%, with GOP margins compressing from 34.3% to 29.4% — that kind of drawdown can wipe out debt service coverage on a leveraged deal within a single operating year.
Defining the Margin of Safety
If a lender requires a minimum DSCR or an investor requires a minimum IRR, sensitivity analysis answers a critical question: how far would occupancy or ADR need to fall before the investment fails to meet that threshold?
That specific number — the break-even occupancy rate — becomes the line management must defend. Without it, risk conversations stay theoretical. With a hard number in hand, the asset manager can build specific monitoring triggers and response protocols around it.
Prioritizing Management Focus
Not all variables matter equally. Sensitivity analysis ranks them. If a 3-point occupancy decline has a larger impact on projected IRR than a 15% increase in operating expenses, management should concentrate monitoring and mitigation efforts on demand drivers — not cost control.
This prioritization matters most where margins diverge sharply by segment. GOP margins differ significantly across hotel types:
- Full-service properties: typically 25–35% GOP margins, with a higher fixed-cost base that amplifies occupancy sensitivity
- Limited-service properties: typically 45–55% GOP margins, with greater structural resilience to demand swings
A limited-service hotel with lean overhead may absorb a 5-point occupancy drop without breaching debt covenants. A full-service asset in the same market may not.
Building Credibility with Investors and Lenders
Presenting sensitivity outputs alongside base-case projections answers the hard question investors always ask — "what if your assumptions are wrong?" — with data rather than optimism. At the term sheet stage, that difference often determines whether a deal advances or stalls.
Sponsors who present scenario analysis signal that they've stress-tested the model, understand the downside, and have a plan for it. That combination — downside awareness plus a credible response plan — is what moves a deal from "interesting" to fundable.
How Startup Financial Model Sensitivity Analysis Works – Step by Step
Building sensitivity analysis into a hotel investment financial model requires more than plugging numbers into a spreadsheet. Each step below covers the method, the output, and where most underwriters go wrong.
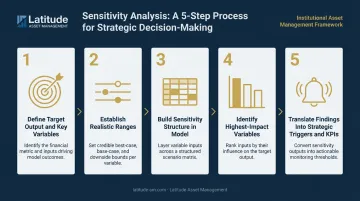
Step 1 – Define the Target Output and Key Input Variables
First, clarify what you're trying to protect or optimize. Common target outputs:
- IRR — equity return over the hold period
- Equity multiple — total return on invested capital
- DSCR — debt service coverage ratio
- Cash-on-cash return — annual cash yield on equity
Then identify the top 3–5 input variables most likely to affect that output. For most hotel models, these are:
- Occupancy rate
- Average Daily Rate (ADR)
- Revenue growth assumptions
- Operating expense ratio / GOP margin
- CapEx and FF&E reserve timing
Common mistake: Testing too many variables simultaneously. This obscures which driver is actually creating risk and produces output that's hard to present or act on.
Step 2 – Establish Realistic Ranges for Each Variable
For each input, define a base-case value and a realistic high/low range. Ranges should reflect actual market volatility — not arbitrary percentages.
Sources to ground your ranges:
- STR competitive set benchmarks
- Historical performance data (the 2009 and 2020 downturns provide useful stress anchors)
- Franchise performance benchmarks
- Lender underwriting standards
For context: national RevPAR fell 16.7% in 2009 and 47.5% in 2020. A downside occupancy range that only extends 3–5 points below base case may be insufficient for stress-testing.
Step 3 – Build the Sensitivity Structure in the Model
With ranges established, the next step is selecting the right table structure. Two standard formats apply:
- One-variable sensitivity table — shows output change for each step change in a single driver (e.g., IRR at occupancy rates from 60% to 80% in 2-point increments)
- Two-variable sensitivity table — shows the compound impact when two drivers change simultaneously (e.g., occupancy vs. ADR grid)
Excel's Data Table feature (under What-If Analysis) is the standard tool for both formats. For presenting results to investors, tornado charts visually rank which variables produce the largest output changes — useful for quickly communicating where risk is concentrated.
Step 4 – Identify the Highest-Impact Variables
Read the sensitivity output by ranking variables by the magnitude of output change they produce per unit of input change. The variable that moves the model most is the one that deserves the most attention in both underwriting and ongoing management.
Once the highest-impact variable is confirmed, it becomes the primary focus of scenario planning — and the first metric to monitor when actual performance begins to diverge from projections.
Step 5 – Translate Findings Into Strategic Triggers and KPIs
Sensitivity outputs have direct operational value. They define:
- Operational KPIs — specific performance thresholds management tracks monthly
- Early-warning triggers — pre-defined thresholds that activate a management response
- Contingency plans — actions ready to deploy if occupancy falls below the break-even level
For example: "If Q2 occupancy drops below X%, implement cost reduction protocol Y and notify lender." This kind of pre-committed response eliminates delay when conditions deteriorate — which is when response speed matters most.
Sensitivity Analysis in Practice: A Hotel Investment Walkthrough
Note: The following is a simplified, illustrative example for a generic select-service hotel. This is not based on a real transaction.
The Setup
A 120-room select-service hotel. Investor is evaluating projected equity returns before closing. Stabilization is assumed by year 2 — consistent with the typical ramp-up period HVS has documented for new-build hotel feasibility studies.
Base-case assumptions:
| Variable | Base Case |
|---|---|
| Occupancy rate | 72% |
| ADR | $145 |
| RevPAR | ~$104 |
| GOP margin | 48% (limited-service) |
| Management fee | 3% of gross revenue |
| Debt service | Fixed-rate, 25-year amortization |
These inputs feed the model's target output: projected IRR and DSCR.
One-Variable Test: Occupancy vs. Operating Costs
When occupancy drops from 72% to 67% (a 5-point decline), the revenue impact is direct and immediate: it reduces room revenue, compresses GOP, and narrows the coverage cushion over debt service. The percentage change in projected IRR from a 5-point occupancy decline will typically exceed the impact of a 10% rise in operating expenses, because revenue changes flow through the model with fewer offsets than cost increases.
This is why management attention should concentrate on demand-side drivers (occupancy and ADR) rather than cost control as the primary lever for protecting returns. Cost management matters, but it's rarely the swing variable.
Two-Variable Test: Occupancy and ADR Combined
The two-variable table shows the compound effect when both occupancy and ADR decline simultaneously. This is the "floor scenario" that lenders use to size the loan and set the minimum equity cushion.
A grid showing DSCR across a range of occupancy rates (60%–75%) and ADR levels ($125–$155) quickly identifies the combinations under which the property can no longer service debt. For example, even a modest ADR erosion from $145 to $130 combined with a 7-point occupancy decline can push DSCR below 1.20x — the threshold at which most lenders require additional reserves or recourse. This information shapes loan sizing, covenant structure, and equity requirements.
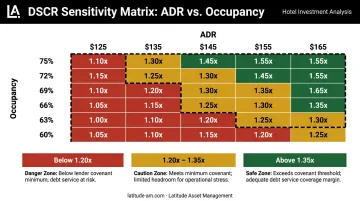
Key combinations to stress-test in this grid:
- Occupancy at 62%, ADR at $125: represents a severe but historically observed trough
- Occupancy at 67%, ADR at $135: a moderate downside consistent with a soft demand year
- Occupancy at 70%, ADR at $145: a near-base scenario useful for covenant floor setting
Three Actionable Outputs
Running these scenarios isn't purely academic — each produces a decision-ready deliverable for ownership and the capital stack.
From this analysis, three concrete items emerge:
- A defined monthly KPI: the asset manager tracks occupancy against the break-even threshold identified in the sensitivity table
- A contingency trigger: if occupancy falls below the DSCR floor in any rolling 90-day period, a pre-defined cost reduction and lender communication protocol activates
- A revised fundraising timeline: the downside ramp-up scenario informs the equity reserve requirement during lease-up, ensuring the capital stack has sufficient cushion if stabilization takes longer than modeled
How Latitude Asset Management Can Help
Sensitivity analysis is only as good as the assumptions behind it. Generic financial models use published industry averages and can't account for a specific market, a specific brand, or an operator's realistic performance range.
Latitude Asset Management brings a different foundation. The team has operated big-box hotels, negotiated franchise and management contracts with major international brands, and managed assets through multiple market cycles across the U.S., Mexico, the Caribbean, Colombia, and broader Latin America.
That operating history makes the input assumptions in their models defensible.
The team behind the model includes:
- Javier Revelo, CFA — Financial Analysis & Research Advisor covering acquisitions, portfolio strategy, and performance initiatives, with a background in institutional investment management, portfolio risk, and hospitality analytics
- Anthony Del Gaudio — 35+ years across Hyatt, Loews, and IHG; ramp-up timelines, cost structures, and brand performance assumptions reflect real contractual experience, not desk research
- Germán Ongay — 40+ years in Mexico's hotel industry, including direct franchise negotiations with major international brands; ADR uplift and cost assumptions for Mexican assets reflect actual deal terms
- Olmedo Herrera — decades leading full-service hotel operations across Latin America, providing on-the-ground calibration for regional sensitivity inputs

For investors entering markets outside the U.S., this regional depth matters. Local demand drivers, currency exposure, and regulatory factors shift the sensitivity ranges in ways a generic model simply won't capture.
As Latitude's underwriting philosophy states directly: "Proper underwriting is not just a spreadsheet exercise — it demands informed judgment, forward-looking analysis, and operational insight to assess how an asset may perform across different market conditions."
Conclusion
Sensitivity analysis transforms a hotel investment financial model from a static projection into a risk-management tool. It tells investors not just what returns look like in the best case, but exactly how much adversity the deal can absorb before return thresholds are breached.
It is not a one-time exercise. Sensitivity analysis should be revisited at each major milestone — pre-acquisition, pre-opening, end of year one, and any refinancing or capital event — as real performance data steadily replaces the assumptions it was built on. Each update tightens the picture, reducing the gap between projected and actual performance — and sharpening the decisions that follow.
Owners, operators, and investors who treat sensitivity analysis as a living management tool are better positioned to protect capital, navigate disruption, and act decisively when market conditions shift.
Frequently Asked Questions
What is the difference between sensitivity analysis and scenario analysis in a startup financial model?
Sensitivity analysis changes one variable at a time — for example, measuring how IRR changes if occupancy drops 5 points while all other inputs hold constant. Scenario analysis changes multiple related variables simultaneously to model a coherent situation, like a market downturn combining lower demand, higher costs, and tighter financing. Most rigorous hotel investment models use both.
What are the most important variables to test in a hotel investment financial model?
The primary drivers to test are:
- Occupancy rate, ADR, and RevPAR
- Gross operating profit margin and operating cost ratios
- CapEx and FF&E timing
- Debt service coverage
Which variable matters most depends on the asset type — a limited-service hotel with strong margins behaves differently than a full-service property with a high fixed-cost base.
How does sensitivity analysis help when pitching hotel investors or lenders?
It demonstrates risk awareness and financial discipline, shows the margin of safety on return thresholds, and answers hard investor questions with quantified evidence rather than optimistic assumptions. Investors who see a well-constructed sensitivity table know the operator has stress-tested their own projections.
How often should a hotel startup financial model's sensitivity analysis be updated?
Update it at each major milestone: pre-acquisition, pre-opening, end of year one, and at any refinancing or major capital event. As actual occupancy, ADR, and cost data accumulate, real numbers should progressively replace original assumptions, making the model more accurate over time.
What tools are best for running sensitivity analysis on a hotel financial model?
Excel is the standard — specifically the Data Table feature under What-If Analysis, which handles one- and two-variable sensitivity grids efficiently. Tornado charts are useful for visualizing variable rankings. The tool matters less than the assumptions feeding it — realistic inputs outweigh any software advantage.
Can sensitivity analysis predict whether a hotel investment will succeed?
No. Sensitivity analysis cannot predict outcomes, but it can define the conditions under which an investment succeeds or fails. Its value lies in knowing which variables to monitor and what interventions to prepare before performance deviates from plan.