
Introduction
Most investors know they should diversify. Far fewer have a systematic framework for how to divide their portfolio among asset classes — and that gap is where long-term returns are actually won or lost.
The evidence on this is clear. The landmark Brinson, Hood, and Beebower studies, published in the Financial Analysts Journal in 1986 and 1991, found that asset allocation policy explained 91.5–93.6% of the period-to-period variability in portfolio returns across large pension funds. Asset allocation, not stock selection or market timing, drives the vast majority of portfolio outcomes.
This article covers what asset allocation actually means, the major asset classes every investor should understand, how to select a model that fits your goals, and the practical discipline required to keep your strategy on track over time.
Key Takeaways
- Asset allocation — dividing a portfolio among different asset categories — is the single most consequential structural decision an investor makes.
- Choosing the right model (conservative, balanced, or growth) hinges on your time horizon, risk tolerance, liquidity needs, and financial goals.
- Diversification within and across asset classes reduces concentration risk without eliminating growth potential.
- Real estate and hospitality assets offer meaningful diversification — but only when managed with sector-specific expertise.
- Rebalance periodically to keep allocations aligned with your target strategy as markets move.
What Is Asset Allocation and Why Does It Matter?
Asset allocation is the process of dividing a portfolio among different asset categories — stocks, bonds, cash, and real assets — to balance risk and return in line with specific goals. This decision comes before individual securities are selected and shapes everything that follows.
Strategic vs. Tactical Allocation
For most investors, a clear strategic allocation executed consistently outperforms frequent tactical shifts — which add timing risk and implementation friction without a reliable return premium to justify them.
The Risk-Return Tradeoff
Heavier equity exposure has historically produced higher long-term returns alongside greater short-term volatility. Capital preservation strategies — weighted toward bonds and cash — sacrifice growth for stability. The appropriate balance hinges on three factors: your investment horizon, your liquidity needs, and your actual tolerance for drawdowns — not just your stated comfort with risk.
Asset Allocation vs. Diversification
These are related but distinct decisions. Asset allocation defines which categories you invest in — stocks, bonds, real estate, cash. Diversification determines how broadly you invest within each category.
A portfolio concentrated entirely in large-cap U.S. equities has an asset allocation. It isn't diversified. Both decisions require deliberate attention; getting the category mix right while ignoring concentration within it leaves meaningful risk unmanaged.
The Major Asset Classes at a Glance
Stocks (Equities)
Stocks represent ownership in companies and carry the highest historical growth potential among major asset classes. From 1928 to 2024, the S&P 500 compounded at approximately 9.94% annually, according to NYU Stern professor Aswath Damodaran's historical data.
That growth comes with volatility. The S&P 500 produced negative total returns in 26 of 97 years — roughly one in four years — making time horizon a critical factor in how much equity exposure makes sense.
Bonds (Fixed Income)
Bonds function as loans to governments or corporations that pay interest over time. Over the same 1928–2024 period, 10-year U.S. Treasuries compounded at approximately 4.50% annually — substantially lower than equities, but with far less volatility.
One key risk: bond prices and interest rates move in opposite directions. When rates rise, existing fixed-rate bonds lose market value. The 2022 environment demonstrated this painfully, hitting both stocks and bonds simultaneously.
Cash and Cash Equivalents
Savings accounts, CDs, and money market funds are the most liquid, lowest-risk asset class. Three-month T-bills returned approximately 3.36% annually from 1928–2024 — but the primary concern is inflation. When cash returns trail inflation, purchasing power erodes — which is why most investors size their cash position around near-term liquidity needs, not long-term growth targets.
How the three major asset classes compare at a glance:
| Asset Class | Historical Annual Return (1928–2024) | Primary Risk | Portfolio Role |
|---|---|---|---|
| Stocks (S&P 500) | ~9.94% | Volatility / drawdowns | Long-term growth |
| Bonds (10-yr Treasuries) | ~4.50% | Interest rate sensitivity | Income / diversification |
| Cash (3-mo T-bills) | ~3.36% | Inflation erosion | Liquidity reserve |
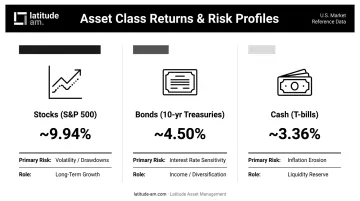
Returns sourced from Damodaran's historical data. Past performance does not guarantee future results.
Common Asset Allocation Models: Which One Fits Your Goals?
Model portfolios are pre-defined allocation frameworks designed to match a general investor profile. They're starting points — not prescriptions. Every investor's actual allocation should be customized based on individual circumstances.
Conservative (Income-Focused)
Approximately 20% equities / 50% bonds / 30% short-term. Suited for investors near or in retirement, those with low risk tolerance, or anyone with a short time horizon. Prioritizes capital preservation and income over growth. The tradeoff: limited participation in bull markets.
Balanced
Approximately 50% equities / 40% bonds / 10% short-term. The classic middle path for moderate risk tolerance and medium-to-long time horizons. The well-known 60/40 portfolio sits in this range.
The 60/40 model has faced scrutiny in recent years. CFA Institute's 2025 review highlights variable stock-bond correlations as a central challenge. During the recent rate-hiking period, Morningstar calculated a stock-bond correlation of 0.64, versus -0.24 during the prior low-rate era. Positive correlation undermines bonds' ability to cushion equity losses. That said, higher starting bond yields have restored some of the model's income and loss-absorption capacity — 60/40 isn't dead, but it requires context.
Growth
Where the Balanced model trades some growth for stability, the Growth model tilts the other direction.
Approximately 70% equities / 25% bonds / 5% short-term. Appropriate for investors with high risk tolerance and long time horizons (10+ years) focused primarily on wealth accumulation. Short-term drawdowns can be significant; long-term compounding historically rewards patience.
Aggressive Growth
Approximately 85% equities / 15% bonds / 0% short-term. Suited for very long investment horizons and investors who can withstand significant market swings without abandoning their strategy. Appropriate for younger investors in accumulation phases who have both the time and the discipline to stay invested through corrections.
Model Comparison at a Glance
| Model | Equities | Bonds | Short-Term | Risk Level | Time Horizon | Best Fit |
|---|---|---|---|---|---|---|
| Conservative | ~20% | ~50% | ~30% | Low | Short (0–5 yrs) | Near/in retirement, low tolerance |
| Balanced | ~50% | ~40% | ~10% | Moderate | Medium (5–10 yrs) | Growth + stability seekers |
| Growth | ~70% | ~25% | ~5% | Moderate-High | Long (10+ yrs) | Wealth accumulators |
| Aggressive Growth | ~85% | ~15% | 0% | High | Very Long (15+ yrs) | Young investors, high conviction |
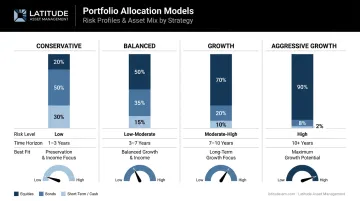
Weights based on Fidelity model portfolio examples. Labels and weights vary by provider.
Key Factors That Should Shape Your Asset Allocation Decision
Time Horizon
The longer your time horizon, the more risk you can absorb — there's simply more time to recover from downturns. Consider how differently two scenarios play out:
- Saving for a home down payment in 3 years: Almost any meaningful loss would be devastating. A conservative allocation is appropriate.
- Saving for retirement in 25 years: Short-term volatility becomes noise. A growth or aggressive growth allocation makes sense.
That gap — 3 years versus 25 — often determines the entire shape of a portfolio.
Risk Tolerance
Two dimensions matter here, and both must be respected:
- Emotional risk tolerance: How much volatility can you handle without making panic-driven decisions?
- Financial risk capacity: How much loss can you actually afford given your income, savings, and liabilities?
Overestimating emotional tolerance is a costly mistake. An allocation that looks right on paper becomes harmful the moment it triggers a panic sell during a downturn — turning a temporary loss into a permanent one.
Financial Goals and Liquidity Needs
Different goals require different approaches:
- Retirement income → income-generating allocation with stable assets
- Wealth accumulation → growth-oriented with higher equity exposure
- Major near-term purchase → conservative, capital-preservation focus
Investors with near-term liquidity needs should maintain a more conservative allocation regardless of their stated risk tolerance. Liquidity constraints don't negotiate with market cycles — your allocation should account for that reality before you need the cash.
Real Estate and Alternative Investments as Portfolio Diversifiers
Alternative asset classes — particularly real estate — have become standard components of institutional portfolios. According to Preqin's 2024 Institutional Allocation Study, the average institutional allocation to alternatives increased from 18.4% to 20.0% over five years. The appeal is threefold: alternatives tend to move independently of public markets, they can generate ongoing income, and select asset classes offer meaningful inflation protection.
Hospitality Real Estate as a Distinct Asset Class
Hotel investments occupy a specific place within real assets. Revenue is tied to room metrics — RevPAR (revenue per available room), occupancy, and average daily rate — which respond to different drivers than equity markets. That distinction is the source of their diversification potential.
A few important nuances from CBRE's research:
- Most hotel returns were not sensitive to low-to-moderate inflation
- Luxury hotels showed the most promise as inflation hedges, given their daily repricing capacity
- RevPAR is cyclically sensitive — CoStar/STR reported that U.S. RevPAR fell 0.3% in 2025, its first full-year decline since 2020, confirming hotels' exposure to economic cycles
Hospitality real estate offers a distinct income and repricing mechanism — but it also carries real cyclicality and illiquidity. Investors should evaluate these assets on market cycle positioning, operator quality, brand alignment, and capital structure, not yield alone. That complexity is precisely where active management determines outcomes.
Where Active Management Makes the Difference
Unlike publicly traded REITs, direct hotel investments require hands-on asset management to protect and extract value. Firms like Latitude Asset Management — whose team includes Cornell-certified hotel investment professionals and former executives from Hyatt, Loews, and IHG — oversee everything from brand and operator selection to ongoing performance management and capital planning.
Brand conversions, for example, can drive 15–40% ADR increases in markets where assets have been undermanaged — particularly in Latin America, where operational gaps often present the greatest opportunity. That kind of value creation requires sector-specific expertise that passive real estate exposure simply cannot provide.

Practical Tips for Managing and Rebalancing Your Portfolio
How Rebalancing Works
Over time, strong-performing asset classes grow beyond their intended portfolio weight, increasing risk exposure. Rebalancing restores the original allocation by trimming over-weighted positions and adding to under-weighted ones.
Two common approaches:
- Calendar-based: Rebalance annually or semi-annually on a fixed schedule
- Threshold-based: Rebalance when an asset class drifts more than 5 percentage points from its target weight (Vanguard's standard example for a 70/30 portfolio)
Most investors find annual rebalancing sufficient. Consistency matters more than frequency.
Tax-Efficient Rebalancing
Selling appreciated assets in taxable accounts triggers capital gains. Before executing large rebalancing transactions, consider:
- Directing new contributions toward under-weighted asset classes first
- Rebalancing within tax-advantaged accounts (IRAs, 401(k)s) where transactions don't create immediate tax consequences
- Using tax-loss harvesting to offset gains — realized losses can offset capital gains and up to $3,000 of ordinary income annually, subject to wash-sale rules
Consult a tax advisor before making significant rebalancing moves in taxable accounts.
Stay Invested Through Volatility
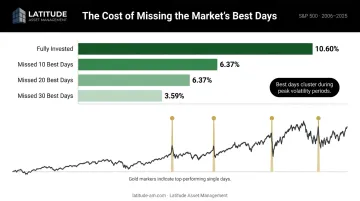
Abandoning a sound strategy during market stress tends to cost investors more than a suboptimal allocation ever would. The cost of market timing is measurable.
J.P. Morgan's Guide to the Markets shows that a fully invested S&P 500 portfolio from January 2006 to December 2025 returned 10.60% annualized. Missing just the 10 best days dropped that return to 6.37%. Those best days tend to cluster during or immediately after periods of peak volatility — exactly when investors are most tempted to exit.
A rules-based rebalancing approach keeps decision-making systematic — so your process, not market anxiety, determines when you act.
Frequently Asked Questions
What is the 70/20/10 investment strategy?
The 70/20/10 framework generally allocates 70% to core stable investments, 20% to growth-oriented assets, and 10% to speculative or alternative positions. No single authoritative source has standardized its components — treat it as a conceptual risk-management guide, not a formal model.
What is Warren Buffett's 90/10 rule?
In his 2013 Berkshire Hathaway letter, Buffett instructed his estate trustee to put 90% in a low-cost S&P 500 index fund and 10% in short-term government bonds. It reflects his conviction that broad equity exposure at minimal cost suits most long-term investors — but this was an estate instruction for a specific context, not a universal recommendation.
What is the 10/5/3 rule of investment?
The 10/5/3 rule describes approximate long-term average annual returns by asset class: roughly 10% for equities, 5% for bonds, and 3% for cash. Historical data supports these as directional benchmarks — the S&P 500 compounded at 9.94% from 1928–2024, Treasuries at 4.50%, and T-bills at 3.36%. These are planning reference points, not guarantees.
How much money do I need to invest to make $3,000 a month?
Using the 4% withdrawal framework as a reference: $3,000/month equals $36,000 annually. At a 4% initial withdrawal rate, that requires approximately $900,000 in portfolio assets ($36,000 ÷ 0.04). Higher-yielding assets can alter the math, but generally come with higher risk. A financial advisor can help model this against your specific situation.
What is the difference between asset allocation and diversification?
Asset allocation determines how you divide your portfolio among broad categories — stocks, bonds, real estate, cash. Diversification is how broadly you invest within those categories to reduce concentration risk. Both are essential: allocation sets the strategic framework, diversification fills it in properly.
How often should I rebalance my investment portfolio?
Most financial professionals recommend reviewing allocation at least annually or after any major life change. A threshold approach — rebalancing when an asset class drifts 5% or more from its target — works well for investors who prefer a trigger-based system. The key is having a consistent process, not reacting to market noise.