Introduction
Financial statements tell you what happened. A financial analysis report tells you what to do next. In hotel investing, that gap separates owners who catch problems early from those who discover them after the damage is done.
Hotels are operationally complex assets. Revenue shifts daily, cost structures involve management agreements and franchise fees, and asset value moves directly with operating performance.
A well-structured financial analysis report cuts through that complexity to surface what the numbers mean for your investment.
This guide covers:
- What a hotel financial analysis report is and why it matters
- What it must include to be decision-useful
- How to build one, step by step
- A sample walkthrough applied to a fictional mid-scale hotel scenario
Whether you're in pre-acquisition due diligence, active ownership, or preparing for disposition, the framework applies across the investment lifecycle.
Key Takeaways
- Financial analysis reports transform income statements, balance sheets, and cash flow data into decision-ready insights — not raw numbers
- Hotel reports must include hospitality-specific KPIs: RevPAR, GOPPAR, NOI, cap rate, and DSCR
- Complete reports cover six components: executive summary, financial statements, key metrics, period comparisons, risk insights, and recommendations
- Hotel lenders typically require DSCR of 1.30x–1.50x — making covenant tracking a non-negotiable reporting element
- Consistent monthly and quarterly reporting lets owners catch performance gaps before they become lender or valuation problems
What Is a Financial Analysis Report?
A financial analysis report is a structured document that evaluates an entity's financial position, performance, and outlook by interpreting data from its core financial statements. It translates raw figures into meaning — identifying what the numbers signal and what decisions they should drive.
Financial Statements vs. Financial Analysis Reports
The distinction matters:
- Financial statements (income statement, balance sheet, cash flow statement) are the raw source data — they record transactions and balances
- A financial analysis report is the interpretive layer that applies ratios, benchmarks, trend comparisons, and narrative context to those figures
A statement records that occupancy fell 8%. The analysis tells you whether that decline is market-wide or asset-specific, how it affects debt coverage, and what to do about it.
Types of Analysis Used in Hotel Investment Reports
Most hotel investment reports combine several analytical approaches into one integrated document:
- Profitability analysis — margin trends, departmental contribution, GOP performance
- Liquidity analysis — current ratio, working capital, reserve adequacy
- Cash flow analysis — operating cash generation, debt service capacity
- Variance analysis — actual versus budget at the revenue and expense line level
- Scenario/sensitivity analysis — stress-testing assumptions across demand cycles or rate environments
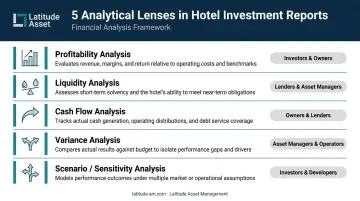
Each of these lenses serves a different stakeholder need — from lenders focused on coverage ratios to equity investors tracking return on capital. The sections that follow outline how these analytical layers come together in a complete report structure.
Key Components of a Hotel Financial Analysis Report
Executive Summary and Key Findings
This is the section decision-makers read first and most closely. It should summarize the top three to five financial conclusions in plain language, flag material risks, and link each finding to a specific recommended action.
Draft it last — after the full analysis is complete — then place it at the front of the report.
Done well, the executive summary reads like a briefing: here's what the asset is doing, here's what's at risk, here's what to do about it. Done poorly, it buries findings in financial jargon or lists observations without connecting them to decisions.
Financial Statement Overview
This section documents the inputs used in the analysis:
- Which statements were reviewed (income statement, balance sheet, cash flow statement)
- The periods covered and basis of preparation (GAAP, IFRS, or management accounts)
- Whether figures have been audited, reviewed, or are internally prepared
- For hotel assets specifically: whether departmental reporting follows the Uniform System of Accounts for the Lodging Industry (USALI)
USALI is the worldwide authoritative standard for lodging financial and operating reporting, with the 12th Revised Edition carrying an adoption date of January 1, 2026. It adds schedules for Energy, Water and Waste, Payroll FTEs, and mandatory brand and operator costs. Any serious hotel financial analysis should align with this framework.
Hospitality-Specific KPIs and Financial Ratios
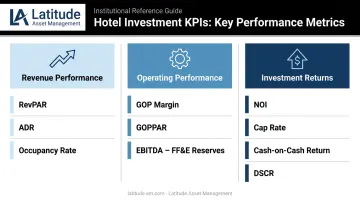
A hotel report must go well beyond standard corporate ratios. The core metrics fall into three categories:
| Category | Key Metrics |
|---|---|
| Revenue performance | RevPAR, ADR, Occupancy Rate |
| Operating performance | GOP margin, GOPPAR, EBITDA minus FF&E reserves |
| Investment returns | NOI, Cap Rate, Cash-on-Cash Return, DSCR |
Each metric should be presented with prior-period comparisons and benchmarked against the competitive set or market average where available. According to STR's glossary, RevPAR equals room revenue divided by available rooms; GOPPAR equals gross operating profit divided by available rooms — the two together give a cleaner picture of both top-line and property-wide profitability.
Standard financial ratios — current ratio, debt-to-equity, net profit margin — still belong in the report but should be interpreted alongside the hospitality-specific metrics, not instead of them.
Period Comparisons and Market Benchmarks
Comparing results against prior periods reveals internal trends. Benchmarking against external data shows whether the asset is gaining or losing share against its competitive set.
For reliable benchmarking data, the primary sources are:
- STR / CoStar — covers approximately 94,000 hotels and 12 million rooms globally; provides occupancy, ADR, RevPAR, and competitive set comparison through Market Penetration Index (MPI), ADR Index (ARI), and Revenue Generation Index (RGI), where 100 represents fair share
- CBRE Hotels Research — Trends compiles thousands of hotel financial statements; Hotel Horizons provides five-year supply, demand, and RevPAR forecasts
- HVS — operating statement data by hotel type, with a proprietary database exceeding 10,000 financial statements
A critical caveat: CBRE's 2024 preliminary sample of 2,600 U.S. hotels shows total revenue rising 2.3% while labor costs rose 4.8%. That spread — costs outpacing revenue — is the kind of signal that looks benign in an operating summary but becomes a clear warning flag in a structured financial analysis.
Risk Insights and Actionable Recommendations
This section separates a high-quality report from a data summary. It translates financial findings into specific operational or capital risks, tied to concrete recommended actions.
Examples of risks that structured analysis surfaces:
- DSCR approaching covenant thresholds, requiring a proactive lender conversation before a breach forces one
- Labor cost rising as a percentage of revenue, pointing to an efficiency gap that an occupancy-threshold productivity review can quantify
- RevPAR declining relative to the comp set, which typically signals a segment mix or distribution problem rather than pure market softness
- Deferred maintenance suppressing ADR, converting a capital planning question into a decision with a defined timeline and ROI threshold
Each risk should have an owner and a recommended action. "Monitor the situation" is not a recommendation.
How to Write a Financial Analysis Report: Step by Step
Step 1 – Gather and Verify Source Data
Collect the income statement, balance sheet, cash flow statement, and USALI departmental schedules for all periods under review. Cross-check figures for internal consistency — revenue totals, payroll allocations, reserve contributions — and confirm that data reflects actual results, not projections.
Common failure here: Building analysis on unreconciled management summaries. No reliable conclusions can be drawn from incomplete or inconsistent inputs.
Step 2 – Select the Right Analysis Framework
Match your analytical approach to the audience:
- Lender → prioritize DSCR, interest coverage, liquidity
- Equity investor → focus on NOI, IRR, cash-on-cash return
- Asset manager (quarterly review) → run profitability, variance, and efficiency analysis
Documenting scope decisions upfront keeps the report focused and builds credibility with whoever receives it.
Step 3 – Calculate Key Ratios and Hospitality Metrics
Apply your chosen methods to verified data. Calculate both standard ratios and hospitality-specific KPIs side by side for current and prior periods. Flag any metric that falls outside acceptable ranges or shows a sustained directional shift. A single bad quarter warrants a note. A three-quarter trend warrants a response.
Step 4 – Benchmark and Identify Trends
Compare calculated metrics against STR comp set data and prior periods. The core analytical question: is a declining trend market-wide or asset-specific?
The answer changes the recommended response entirely:
- Market RevPAR flat, yours down 12% → asset-specific problem; operational or positioning response required
- Comp set down 10%, yours down 12% → market headwinds with a marginal gap; context-sensitive approach
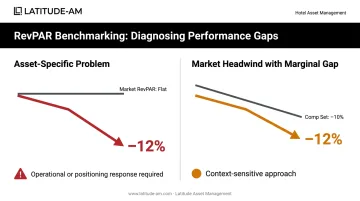
That distinction shapes both the urgency and the nature of any corrective action.
Step 5 – Write the Executive Summary and Recommendations
Draft this section last. Distill the three to five most significant findings into clear, direct language accessible to each audience type. Every material finding needs a specific recommendation — not a suggestion to "monitor," but a named action with a responsible party.
Tailor language to the audience. A lender wants covenant compliance framing. An equity partner wants return implications. An operator wants operational specificity.
Step 6 – Present Findings and Follow Up
Prepare a presentation-ready version for investor or owner review. Lead with the executive summary. Document decisions and agreed actions from the review meeting, and schedule a follow-up at the next reporting cycle to track whether key metrics have improved.
The report's value is realized in what happens after delivery — decisions made, actions assigned, and metrics monitored against targets.
Hotel Financial Analysis Report: Sample Walkthrough
This is a simplified illustration applied to a fictional mid-scale hotel in a Latin American market. The structure mirrors the six steps above.
Data Gathering and Initial Findings
The fictional property — call it Hotel Meridian — shows three concerning signals on initial data review:
- RevPAR of $68 versus a comp set average of $79 — an 11-point gap suggesting underperformance relative to the competitive set
- Total labor cost at 41% of revenue versus a U.S. industry reference of approximately 34.4% — an elevated efficiency gap
- DSCR of 1.28x — below the 1.30x–1.50x range that hotel lenders typically require, approaching covenant risk
A simple operating summary would show declining revenue and rising costs. What it would not show is where the RevPAR gap is coming from, how close the DSCR is to a covenant breach, or whether the labor inefficiency is structural or temporary.
Benchmarking and Trend Identification
Horizontal analysis (period-over-period comparison) reveals the RevPAR decline started two periods ago. The pattern correlates with a reduction in group segment production — a sales and segment mix problem that calls for a fundamentally different operational response than a pricing adjustment would.
Vertical analysis (each line item as a percentage of total revenue) shows labor cost rising from 36% to 41% of revenue over three periods. The trend is directional and sustained, not a one-time payroll spike. An asset manager reviewing a monthly operating summary might see the cost line as elevated; the vertical analysis makes the drift visible and quantifiable.
From Findings to Recommendations
The executive summary for Hotel Meridian would recommend three specific actions:
- Renegotiate the group sales strategy with the operator — establish group segment targets, booking pace thresholds, and a reporting cadence with accountability measures tied to the management agreement
- Implement a labor productivity review tied to occupancy thresholds — define staffing ratios at different occupancy bands and establish a monthly variance review process
- Proactively engage the lender with a covenant compliance plan — present the DSCR trend, document the corrective actions underway, and establish a communication protocol before the next reporting date
Each recommendation is specific, owner-actionable, and directly traceable to a financial finding. That traceability — from metric to diagnosis to corrective action — is what separates financial analysis that drives decisions from financial reporting that merely records them.
How Latitude Asset Management Can Help
Latitude Asset Management works with hotel owners, investors, and lenders across the Americas who need financial analysis reports that go beyond generic templates. The firm combines CFA-level financial rigor — led by Javier Revelo, Financial Analysis & Research Advisor and CFA charterholder — with deep hospitality operating expertise from a team that includes former brand executives from Hyatt, Loews, and IHG.
That combination matters. Financial analysis for hotel assets requires both institutional analytical discipline and a practical understanding of how hotels actually perform. Javier's background spans institutional portfolio risk management and hospitality revenue analytics. Haizar Baiz, CEO and Cornell-certified hotel investment professional, brings 18 years of operational and investor-facing experience across the Americas.
Latitude supports financial analysis across the full investment lifecycle:
- Pre-acquisition : disciplined underwriting, scenario analysis, and capital structure evaluation
- Active ownership : periodic asset performance reporting, variance analysis, and operator accountability
- Pre-disposition : financial packaging and performance substantiation to support valuation and attract capital

With regional partners in Mexico, Colombia, and the Caribbean, and a multilingual team fluent in English, Spanish, Portuguese, and French, Latitude is structured for the cross-border complexity that Americas hotel investments routinely involve.
Schedule a consultation at latitude-am.com or reach the team directly at anthony@latitude-am.com or haizar@latitude-am.com.
Conclusion
A financial analysis report is only as useful as its ability to translate data into decisions. For hotel investors, that means combining standard financial rigor with hospitality-specific insight to see what the numbers are actually telling you about an asset's performance and trajectory.
Financial reporting is not a one-time exercise. It should be updated as market conditions shift and operating performance evolves. A disciplined review cadence looks like this:
- Monthly — for stressed or underperforming assets requiring close monitoring
- Quarterly — for active ownership periods with ongoing operational oversight
- Annually — as a comprehensive baseline across the full investment lifecycle
Owners who build this rhythm into their asset management process stay ahead of problems. Those who don't tend to find out about them too late.
Frequently Asked Questions
What is a financial analysis report?
A financial analysis report is a structured document that interprets data from financial statements — income statement, balance sheet, cash flow statement — to evaluate financial health, performance, and outlook. It produces insights that support investment, operational, or lending decisions rather than simply recording what occurred.
What does a financial analyst report look like?
A typical report includes an executive summary, reviewed financial statements, calculated ratios and KPIs with period comparisons, a benchmarking section, and recommendations — presented through tables, charts, and narrative tailored to the intended audience.
What financial metrics matter most in a hotel investment analysis report?
Core hospitality KPIs include RevPAR, ADR, occupancy rate, GOPPAR, NOI, cap rate, and DSCR, complemented by standard ratios such as net profit margin, current ratio, and debt-to-equity. The most relevant metrics shift by audience — lenders prioritize DSCR and liquidity, while equity investors focus on NOI and cash-on-cash return.
What is the difference between a financial analysis report and a financial statement?
Financial statements record what happened. A financial analysis report interprets what those results mean — applying ratios, trend comparisons, benchmarks, and narrative commentary to turn raw data into actionable conclusions.
How often should a hotel financial analysis report be prepared?
At minimum, a quarterly operational review and a comprehensive annual report for most hotel investments. Monthly reporting is appropriate for assets in lease-up, experiencing performance stress, or approaching lender covenant thresholds.
What data is needed to write a hotel financial analysis report?
Core inputs: income statement (ideally in USALI departmental format), balance sheet, cash flow statement, STR competitive benchmarking data, loan documents for covenant tracking, and budget or forecast files for variance analysis.