
Introduction
Most investors want the same thing: steady income that doesn't require constant attention, doesn't eat itself alive in fees, and doesn't depend on picking the next hot stock. The challenge is getting there without a six-figure lump sum sitting idle in a brokerage account.
A low-cost dividend portfolio solves both problems simultaneously. "Low-cost" means two things here: keeping expense ratios, commissions, and management fees as small as possible, and building the portfolio gradually rather than requiring a large upfront investment.
This guide covers what matters most: the four metrics that separate quality dividend payers from traps, the three most practical low-cost strategies, how reinvestment mechanics turn patience into compounding, and the realistic math behind reaching specific income goals.
Key Takeaways:
- Dividend quality matters more than yield alone — high yields often signal risk, not generosity
- Low-cost ETFs deliver instant diversification at expense ratios as low as 0.04%
- Reinvesting dividends accelerates compounding over time
- Screen for payout sustainability — not just payment history — to avoid yield traps
- Income targets require planning around portfolio size, yield, and time horizon
Why a Low-Cost Dividend Portfolio Is a Powerful Wealth-Building Tool
Dividends create something growth stocks rarely offer: income that doesn't depend on selling anything. Companies distribute a portion of profits to shareholders on a set schedule — quarterly, typically — regardless of what the stock price is doing that week.
That consistency matters more than most investors realize. According to Hartford Funds, dividend income averaged 33% of S&P 500 total return from 1940 through 2025, and reinvested dividends with compounding accounted for 85% of cumulative S&P 500 return from 1960 through 2025. These aren't the same calculation — one measures average annual contribution, the other measures long-run compounding — but both point to the same conclusion: ignoring dividends means leaving a substantial portion of total return on the table.
The Stability Advantage
Dividend-paying companies tend to share a common profile: established cash flows, proven business models, and lower volatility than pure growth stocks. Hartford's Ned Davis Research data covering 1973–2025 shows dividend growers and initiators returned 11.6% annually with a 12.7% standard deviation, compared to 2.7% annually with 23.6% standard deviation for non-payers. That's a dramatically better risk-adjusted outcome over five decades.
Why Fees Are the Silent Threat
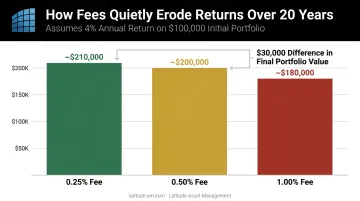
Those return advantages shrink quickly when fees go unchecked. The SEC's hypothetical analysis shows a $100,000 portfolio earning 4% for 20 years ends up at approximately $210,000 at a 0.25% annual fee, $200,000 at 0.50%, and $180,000 at 1.00%. That's a $30,000 gap from fee drag alone.
Low-cost index-style dividend ETFs (with expense ratios often under 0.10%) keep that gap firmly in your favor. At the SEC's 0.25% scenario, a portfolio starting at $100,000 already outperforms the 1.00% scenario by $30,000 over 20 years — and sub-0.10% fees push that advantage further still.
4 Key Metrics Every Dividend Investor Must Know
Understanding these four metrics is the difference between building a durable income stream and accidentally buying a yield trap.
Dividend Yield
Formula: Annual Dividend ÷ Current Share Price × 100
This is your baseline comparison tool, but it comes with a serious caveat. A $50 stock paying $2 per year yields 4% — simple math. The trap is that yield rises automatically when a stock price falls. A company paying $2 per year on a stock that dropped from $50 to $25 now shows an 8% yield, which looks attractive right up until the company cuts the dividend entirely.
Yields significantly above historical norms or industry peers almost always signal a falling price, not a generous payout.
Payout Ratio
Formula: Annual Dividend ÷ Earnings Per Share × 100
This reveals what fraction of profits goes to dividends versus reinvestment. Lower is generally safer for most companies — it means the dividend has room to survive earnings pressure. Capital-intensive sectors like utilities and REITs operate at higher payout ratios by design, so compare within sectors rather than applying one standard across all industries.
Dividend Growth Rate
Companies that raise their dividend 5–10% annually year after year are signaling something important: growing earnings, financial discipline, and management confidence in future cash flows. A flat or declining dividend growth rate deserves scrutiny even when the headline yield looks acceptable. Over a 20-year holding period, a $10,000 investment in a 3% grower versus a 7% grower produces roughly double the annual income — a gap that compounds with every passing year.
Yield on Cost
This is the metric long-term investors love. If you bought a stock at $40 that now pays $3.20 per year, your yield on cost is 8% — even if the current market yield on that stock is only 3.2% because the price has risen to $100. It illustrates concretely why buying quality dividend growers early and holding them pays off in ways the current yield number never shows.
Dividend Safety Screen
Payment history is backward-looking. What actually predicts future dividends is balance sheet strength. Screen for:
- Low debt relative to earnings (manageable leverage)
- Strong free cash flow covering the dividend with room to spare
- A business model that doesn't require perfect market conditions to sustain payouts
GE's 2009 dividend cut — from $0.31 to $0.10 per quarter, saving roughly $9 billion annually according to Reuters — is the textbook example of a company that looked stable by historical measures until it didn't. A basic balance-sheet screen would have flagged that risk before the cut.
Low-Cost Strategies for Building Your Dividend Portfolio
The best low-cost dividend portfolios don't try to do everything. Pick one or two of these approaches based on your time horizon, how involved you want to be, and whether you need current income or long-term growth.
Strategy 1: Dividend ETFs — The Set-It-and-Forget-It Approach
A single dividend ETF purchase gives you immediate exposure to dozens or hundreds of dividend-paying stocks, managed passively at minimal cost. Here are four widely cited options:
| ETF | Expense Ratio | Focus |
|---|---|---|
| VIG | 0.04% | Dividend growth; tracks S&P U.S. Dividend Growers Index |
| SCHD | 0.06% | Quality income; screens for sustainability and fundamentals |
| NOBL | 0.35% | S&P 500 Dividend Aristocrats; equal-weighted, 25-year streak |
| SDY | 0.35% | Higher-yield orientation; 20-year growth requirement |
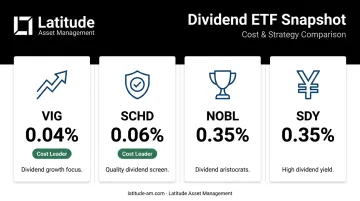
VIG and SCHD are the cost leaders. NOBL and SDY cost more but follow materially different indexes — cost alone doesn't establish equivalence between strategies.
One decision worth making early: accumulating ETFs reinvest dividends inside the fund, so you receive no cash distributions. Distributing ETFs pay income directly to your account. If you're building wealth and don't need current cash, accumulating structures are simpler. If you need income now, distributing is the obvious choice.
Strategy 2: Dividend Aristocrats — The Quality-First Approach
S&P 500 Dividend Aristocrats are companies that have raised their dividend every single year for at least 25 consecutive years — through recessions, market crashes, and interest rate cycles. Johnson & Johnson (64 consecutive increases as of 2026), Procter & Gamble (70 consecutive years), Coca-Cola, and Lowe's all qualify. S&P's official 50-year benchmark is the S&P Dividend Monarchs Index; "Dividend King" is informal shorthand, not an official index name.
Two ways to use this strategy at low cost:
- Passive route: Buy NOBL for equal-weighted Aristocrat exposure across sectors
- Active route: Hand-pick 8–12 Aristocrats spread across 4–6 sectors
The low-cost element in the active approach comes entirely from buying and holding. Frequent trading eliminates the fee advantage.
Strategy 3: Sector-Balanced Portfolio — The Steady Income Approach
Spreading holdings across multiple sectors ensures one bad year in financials or energy doesn't collapse your entire income stream. A five-sector allocation might look like this:
| Sector | Role | Approximate Yield (Recent Snapshot) |
|---|---|---|
| Utilities | High current yield | ~2.81% |
| REITs | Higher yield, required distributions | ~3.71% |
| Consumer Staples | Stability, modest growth | ~2.61% |
| Healthcare | Defensive, consistent | ~1.58% |
| Financials | Growth and income blend | ~1.38% |
REITs are legally required to distribute at least 90% of taxable income to shareholders, which is why they appear in most income-focused portfolios. Publicly traded REIT ETFs provide easy, liquid access to this income stream.
Investors who want direct, private-market exposure to hospitality real estate — rather than through a publicly traded REIT ETF — can work with specialized hotel asset management firms. Latitude Asset Management, for example, advises hotel owners and investors across the U.S., Mexico, the Caribbean, and Latin America on acquisition strategy, asset management, and portfolio structuring throughout the hotel investment lifecycle.
How to Diversify and Minimize Risk
True diversification in a dividend portfolio means structuring holdings so that one sector's collapse doesn't take your income down with it.
Three rules govern how you build that structure:
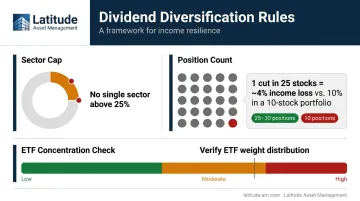
- Sector cap at 25%: No single sector should exceed a quarter of your portfolio. When financials collapsed in 2008–2009, concentrated holders absorbed both price declines and dividend cuts simultaneously — S&P 500 dividends fell roughly 20% in 2009, driven largely by banking cuts. Energy investors saw the same in 2015–2016: Kinder Morgan cut its dividend by 75%, and ConocoPhillips cut for the first time in 25 years.
- 20–30 positions for individual stock pickers: A single dividend cut in a 25-stock portfolio reduces income by about 4%. The same cut in a 10-stock portfolio costs you 10%. Position count is income insurance.
- Check ETF concentration before assuming safety: Some ETFs put 30–40% of weight in their top 10 holdings — diversification by name, not by construction.
The yield trap checklist:
- High yield (above 8–10%) + weak free cash flow = red flag
- High yield + high debt load = red flag
- High yield + deteriorating earnings trend = red flag
Any one of these warrants caution. All three together is a near-certain sign of a pending cut.
Using DRIP to Grow Your Portfolio on Autopilot
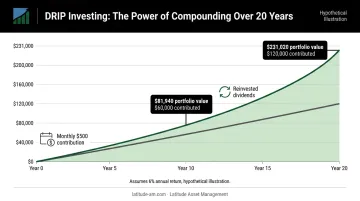
A Dividend Reinvestment Plan (DRIP) automatically uses cash dividends to purchase additional shares — often in fractional amounts, commission-free. The result is a compounding loop: more shares generate larger dividends, which buy more shares, which generate even larger dividends.
With $0 starting capital, $500 contributed monthly, and a hypothetical 6% annual return with monthly compounding, that loop produces approximately $81,940 after 10 years on $60,000 contributed — and $231,020 after 20 years on $120,000 contributed. These are assumed-return illustrations, not guarantees, but the pattern holds: consistent contribution plus reinvestment compounds faster than most investors expect.
Setting Up DRIP
Fidelity, Schwab, and Vanguard all offer commission-free DRIP enrollment — setup takes a few clicks in your account dashboard, and reinvestment runs automatically from there.
One tax note that catches investors off guard: in a taxable account, each reinvested dividend is still a taxable event in the year received, and each reinvestment creates a new cost basis lot. This creates recordkeeping complexity over time. The simpler path is running DRIPs inside a tax-advantaged account — IRA or Roth IRA — where reinvestment compounds without triggering annual tax obligations.
For investors focused on minimizing costs and maximizing long-term accumulation, DRIP inside a tax-sheltered account is about as close to a set-and-forget growth engine as dividend investing gets.
How Much Capital Do You Actually Need?
The math is straightforward. Required capital = annual income target ÷ portfolio yield.
| Annual Income Target | Portfolio Yield | Required Capital |
|---|---|---|
| $12,000 ($1,000/month) | 4% | ~$300,000 |
| $12,000 ($1,000/month) | 6% | ~$200,000 |
The 6% scenario requires less capital but accepts higher risk. A 6% portfolio yield today typically involves assets with less payout stability than a 4% portfolio built around quality dividend growers. The lower capital requirement at higher yield does not mean equal safety.
You Don't Need to Start With $200,000
The "start small, reinvest, grow" path works for most investors. Getting started is straightforward:
- Open a position in a low-cost dividend ETF with a few hundred dollars
- Add contributions on a monthly schedule
- Enroll in DRIP to automatically reinvest dividends
- Let compounding work over 10–20 years
What actually matters is starting. A portfolio that begins at $5,000 and adds $500 monthly compounds into something meaningful — making even a $300,000 target feel reachable over time.
The Yield vs. Safety Tradeoff
Chasing 7–8% yields to reach income goals faster typically means holding assets with real durability problems:
- Leveraged funds that amplify both gains and losses
- Financially weaker companies with thin dividend coverage
- Sectors with persistently unstable payouts tied to commodity cycles or debt loads
A 3–5% yield range from high-quality payers delivers better risk-adjusted income over the long term than reaching for higher yields that carry real cut risk.
Frequently Asked Questions
How much do I need to invest to make $1,000 a month in dividends?
At a 4% average portfolio yield, approximately $300,000 is needed. At a 6% yield, closer to $200,000 — though higher yields carry more payout risk. Regular contributions combined with DRIP reinvestment let you build toward that number gradually, reducing the lump sum you need to start with.
What is the most profitable dividend strategy?
Dividend growth investing — targeting companies with consistent annual payout increases — tends to produce the highest total returns over long periods through compounding. High-yield strategies deliver more current income but typically build less long-term wealth. Which approach fits depends on whether you need income now or are still in the accumulation phase.
What is a good dividend yield for a low-cost portfolio?
The 3–5% range balances current income with payout sustainability. Yields above 8–10% often signal that the market is pricing in a meaningful probability of a cut — treat them as a prompt to examine financial health, not an opportunity to grab extra income.
How do I avoid dividend traps?
Screen for payout ratio, free cash flow coverage, debt levels, and forward earnings trends. Historical yield and payment streaks tell you about the past, not the future. A long track record reflects past discipline — it does not guarantee the next payment.
Should I use dividend ETFs or individual stocks as a beginner?
Start with one or two low-cost dividend ETFs for instant diversification and a lower minimum investment. As comfort with financial statement analysis grows, individual Aristocrat stocks can be added to the portfolio over time. ETFs remove the single-company cut risk that makes beginners most vulnerable early in the wealth-building process.