
Introduction
Hotel investors who rely on gut instinct alone tend to learn expensive lessons. A property can look attractive on the surface — strong occupancy, a recognizable brand, a prime location — and still destroy capital if the numbers underneath tell a different story.
Financial ratio analysis gives investors a structured way to cut through surface-level appeal. By comparing figures from a hotel's income statement, balance sheet, and cash flow statement, ratios translate raw data into clear signals about a property's liquidity, profitability, leverage, and risk.
This guide covers everything hotel investors and asset managers need to apply this framework with confidence:
- What financial ratio analysis is and why it matters for hotel investments
- The six main ratio categories used in hospitality underwriting
- A practical hotel investment example with real numbers
- A step-by-step process for applying ratios to acquisition and management decisions
Key Takeaways
- Financial ratio analysis compares financial statement figures to evaluate performance, health, and risk across specific dimensions
- Hotel investors rely on both standard corporate ratios and hospitality-specific metrics like DSCR, NOI margin, cap rate, and RevPAR
- Six ratio categories — liquidity, profitability, solvency, efficiency, coverage, and valuation — each measure a distinct dimension of financial health
- No ratio should be read in isolation; compare against prior periods, industry benchmarks, and lender thresholds
- Ratio analysis only delivers value when it drives real investment or operational decisions
What Is Financial Ratio Analysis?
Investopedia defines ratio analysis as the comparison of financial statement data to evaluate a company's liquidity, efficiency, profitability, and solvency. In practice, it means taking two or more figures from a balance sheet, income statement, or cash flow statement and comparing them to answer a specific financial question.
There are two primary applications:
- Trend analysis — tracking a property's own ratios over time to spot improvement or deterioration
- Peer comparison — measuring a property's performance against a competitive set or industry benchmark to identify relative strengths and weaknesses
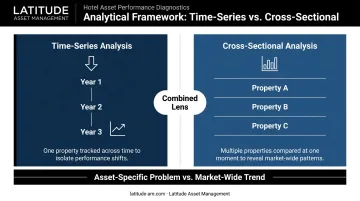
For hotel investors, ratio analysis bridges two disciplines. Standard corporate finance ratios apply at the entity level, while hospitality-specific metrics — RevPAR, GOP margin, DSCR — apply at the property level. Knowing which layer a ratio belongs to is what allows investors to separate asset-specific problems from market-wide trends.
That distinction maps directly to a framework the CFA Institute formalizes: cross-sectional analysis (comparing properties over the same period) versus time-series analysis (tracking one asset over time). Applied together, these two lenses tell hotel investors whether a performance gap is a property problem or a market problem — and that difference drives entirely different decisions.
Types of Financial Ratios Investors Need to Know
No single ratio tells the full story. Each category captures a different dimension of financial health — liquidity, profitability, leverage, efficiency, debt coverage, and valuation — and hotel investors need all six to make sound acquisition, underwriting, or asset management decisions.
Liquidity Ratios
Liquidity ratios measure whether a business can meet short-term obligations using current assets.
| Ratio | Formula | What It Reveals |
|---|---|---|
| Current Ratio | Current Assets ÷ Current Liabilities | Broad short-term coverage |
| Quick Ratio | (Cash + Receivables) ÷ Current Liabilities | Stricter test, excludes inventory |
| Net Working Capital | Current Assets − Current Liabilities | Absolute liquidity cushion |
A current ratio below 1.0 signals potential cash flow stress. For hotels, this is especially relevant given seasonal revenue swings — a property may look liquid in peak season and face real strain in the off-season. CREFC notes that hotel reservations fluctuate substantially by season, and lenders may require funded off-season reserves to stabilize cash flow.
Never interpret liquidity ratios without a monthly cash flow schedule alongside them.
Profitability Ratios
Profitability ratios measure how efficiently a business converts revenue into profit.
Key metrics include:
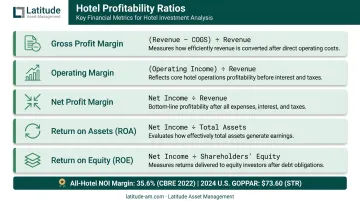
- Gross profit margin — revenue minus cost of goods sold, as a percentage of revenue
- Operating margin — operating income as a percentage of revenue
- Net profit margin — bottom-line profit as a percentage of revenue
- Return on Assets (ROA) — Net Income ÷ Average Total Assets
- Return on Equity (ROE) — Net Income ÷ Average Shareholders' Equity
At the property level, hotel investors use NOI (Net Operating Income) margin and GOP (Gross Operating Profit) margin as the primary equivalents. CBRE reported an all-hotel NOI margin of 35.6% in 2022 and forecast 36.1% for 2024 — useful as directional context, though not a fixed standard for any specific property type or market. STR reported full-year 2024 U.S. GOPPAR of $73.60, up 3.2% year over year.
Solvency and Leverage Ratios
Solvency ratios assess a business's ability to meet long-term obligations.
- Debt-to-Equity Ratio — Total Debt ÷ Total Shareholders' Equity
- Debt-to-Assets Ratio — Total Debt ÷ Total Assets
- Loan-to-Value (LTV) — Loan Amount ÷ Appraised Property Value
A high debt-to-equity ratio signals greater financial risk — critical when evaluating leveraged hotel acquisitions. In hotel real estate specifically, LTV is the more commonly used sizing metric. HVS reported that lenders were comfortable at 55%–65% LTV for stabilized, cash-flowing hotels as of April 2026.
Efficiency (Activity) Ratios
Efficiency ratios measure how well a business uses its assets to generate revenue. Asset turnover (Revenue ÷ Average Total Assets) and receivables turnover apply broadly, but for hotels, two hospitality-specific metrics serve as the primary efficiency benchmarks:
- Occupancy Rate — Rooms Sold ÷ Rooms Available. The AHLA's 2025 State of the Industry report put U.S. hotel occupancy at 62.9% for 2024
- RevPAR — Room Revenue ÷ Rooms Available. The U.S. 2024 figure was $99.71
RevPAR is a demand indicator, not a profitability measure. Pair it with GOP margin, GOPPAR, and asset turnover for a complete operational picture.
Coverage Ratios
Coverage ratios measure a company's ability to service debt from operating income. For hotel real estate, the Debt Service Coverage Ratio (DSCR) is the most critical:
DSCR = NOI ÷ Annual Debt Service
Lenders use DSCR to determine whether a property generates enough income to cover its debt payments. HVS reported a range of 1.30x–1.50x for stabilized hotel lending as of April 2026 — though the OCC notes that hotels' volatile cash flows may justify higher ratios, and no universal minimum applies across all loan structures or markets.
A DSCR below 1.0 means the property cannot cover its debt from operations alone. This is the ratio most likely to surface in lender covenants and underwriting thresholds.
Market Prospect and Valuation Ratios
For publicly traded hospitality companies, standard valuation metrics include the P/E ratio, earnings per share (EPS), and dividend yield.
For private hotel real estate, the capitalization rate (cap rate) is the central valuation metric:
Cap Rate = NOI ÷ Asset Value
Cap rates directly link operating income to property value, making them the standard basis for pricing acquisitions and assessing exit value. CBRE reported an average U.S. hotel cap rate of 8.0% in Q3 2023, against an average hotel CMBS borrowing rate of 8.4% at the same time — a narrow spread that compressed acquisition economics considerably.
How to Perform Financial Ratio Analysis: Step by Step
Effective ratio analysis is a structured process. The most common mistake is calculating ratios without first defining what question the analysis is meant to answer.
Step 1 – Define the Objective
Start with a specific question, not a general review. For example:
- "Does this hotel generate enough NOI to service the proposed debt?"
- "How does this asset's profitability compare to its competitive set?"
- "Is this property's liquidity sufficient to weather a seasonal revenue trough?"
The question determines which ratio categories to prioritize and which benchmarks matter most.
Step 2 – Gather the Right Financial Data
Collect figures from the hotel's income statement, balance sheet, and cash flow statement. For hotel assets, additional data sources typically include:
- STR benchmark reports for competitive set performance
- Operator financial packages and trailing P&Ls
- Management company financials
- Brand-level performance data where available
Accuracy and comparability of source data directly affect the reliability of every ratio you calculate. Reconcile all three financial statements before proceeding.
Step 3 – Calculate the Ratios
Apply the formulas for each relevant category. The math is simple division — the challenge is selecting the right inputs. Common errors include:
- Using end-of-period assets instead of average assets for ROA
- Using EBITDA instead of NOI for DSCR in hotel real estate
- Mixing periods or definitions across comparison properties
Document every numerator, denominator, and time period to ensure consistency.
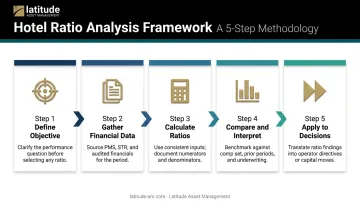
Step 4 – Compare and Interpret Results
No ratio means anything on its own. Compare calculated ratios against:
- Prior periods for the same property (trend analysis)
- Competitive set averages from STR or CBRE benchmarking data
- Internal targets or lender covenant thresholds
- Industry reference points, used as directional context with appropriate caveats
CBRE's Benchmarker aggregates data from more than 6,500 U.S. hotels; STR Benchmark covers approximately 94,000 hotels globally. These are useful for context, but a matched competitive set is more defensible than aggregate averages.
Step 5 – Apply Insights to Decisions
Interpreted ratios are only useful when they inform a specific next move. Each finding should map to a decision:
- Margin compression: Review pricing strategy and cost structure with the operator
- Occupancy shortfalls: Investigate distribution mix and demand segmentation
- Tightening DSCR: Reassess debt terms, refinancing options, or capital reserves
- Low ROA relative to peers warrants a frank evaluation of asset allocation, repositioning, or disposition timing
The investor who acts on ratio findings — adjusting operations, restructuring debt, or reallocating capital — captures value. The one who files the report does not.
Financial Ratio Analysis in Practice: A Hotel Investment Example
Consider a hypothetical mid-scale full-service hotel being evaluated for acquisition. All figures below are illustrative and for demonstration purposes only — real analysis requires verified financials.
Hypothetical hotel inputs:
- Gross Revenue: $8,000,000
- Total Operating Expenses: $5,200,000
- NOI: $2,800,000
- Current Assets: $900,000
- Current Liabilities: $750,000
- Annual Debt Service: $2,100,000
- Acquisition Price: $35,000,000
Ratio calculations:
| Ratio | Formula | Result | Interpretation |
|---|---|---|---|
| Current Ratio | $900K ÷ $750K | 1.20x | Adequate short-term coverage; monitor seasonality |
| NOI Margin | $2.8M ÷ $8.0M | 35.0% | Broadly in line with the 35.6% all-hotel 2022 CBRE benchmark |
| DSCR | $2.8M ÷ $2.1M | 1.33x | Within HVS's 1.30x–1.50x stabilized lending range |
| Cap Rate | $2.8M ÷ $35M | 8.0% | At the Q3 2023 average; signals market-rate pricing |
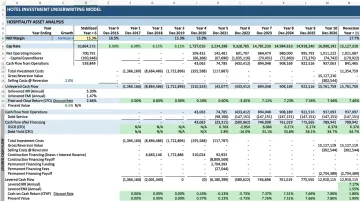
No single ratio tells the full story here. The NOI margin looks healthy and the DSCR clears a typical lender threshold — but only by a modest margin. A 10% revenue decline from a demand shift or new competitive supply would push DSCR to approximately 1.20x, approaching the stress threshold lenders typically flag.
The core risk: operationally profitable assets can still be financially over-leveraged. Strong NOI without sufficient DSCR cushion makes an acquisition high-risk regardless of how attractive the income appears in isolation.
The combined reading across all four ratios suggests this deal could work at current leverage — but the 10% revenue stress scenario should be the minimum test before committing.
How Latitude Asset Management Supports Hotel Investment Decisions
Latitude Asset Management applies financial ratio analysis throughout the hotel investment lifecycle — from pre-acquisition underwriting to ongoing performance monitoring and capital structure evaluation.
The firm's financial analysis is led by Javier Revelo, a CFA charterholder whose background spans institutional investment management, corporate treasury, and hospitality analytics. His work encompasses disciplined underwriting, scenario analysis, and capital structure evaluation — exactly the kind of multi-ratio, stress-tested approach that separates sound acquisitions from costly ones.
What distinguishes Latitude's analytical work is context. A 1.35x DSCR means something different for a stabilized U.S. select-service hotel than for a repositioning opportunity in a Latin American gateway market — and the team interprets benchmarks accordingly.
That contextual judgment comes from direct operating experience. Anthony Del Gaudio's 35+ years across Hyatt, Loews, and IHG informs how the firm reads ratio benchmarks across hotel categories. Haizar Baiz's background operating large-scale hotels and representing major brands across the Americas adds an operator's lens on efficiency and profitability metrics that purely financial analysts often miss.
Across managed assets, Latitude monitors key ratios continuously as a proactive management tool. When margins compress or coverage tightens, the team is already in conversation with operators about corrective action — before problems escalate.
That ongoing oversight spans several core functions:
- Tracking DSCR, NOI margin, and RevPAR index against underwriting assumptions
- Flagging early-stage performance drift before it affects debt service capacity
- Coordinating with operators on cost structure and revenue strategy adjustments
- Evaluating capital structure options when refinancing or repositioning is on the table
For investors evaluating acquisitions or owners seeking structured performance oversight, Latitude combines cross-border market knowledge with multi-ratio underwriting discipline — turning financial metrics into decisions, not just reports.
Frequently Asked Questions
What are the 7 types of ratio analysis?
The seven commonly cited types are liquidity, solvency, profitability, efficiency (activity), coverage, market prospect, and leverage ratios. Some frameworks group leverage within solvency, which is why you'll see lists ranging from six to seven categories.
What financial ratios do hotel investors use most?
DSCR, NOI margin, cap rate, debt-to-equity ratio, and RevPAR are the most widely referenced metrics in hotel investment analysis. Together, they capture both property-level operations and investment-level returns.
How do you perform financial ratio analysis step by step?
Follow these five steps:
- Define the objective and scope of the analysis
- Gather financial data from all three statements
- Calculate relevant ratios using consistent definitions
- Compare results against benchmarks and historical trends
- Apply insights to a specific operational or investment decision
What are the main limitations of financial ratio analysis?
Ratios are backward-looking, can vary significantly by market and property type, and may be distorted by accounting policy differences. They should always be interpreted alongside qualitative context and other quantitative data rather than in isolation.
What is a healthy debt service coverage ratio for a hotel?
HVS reported a range of 1.30x–1.50x for stabilized hotel lending as of April 2026, meaning the property generates 30–50% more NOI than required to cover debt payments. Thresholds vary by lender, loan type, market, and asset stability.
How does ratio analysis support hotel asset management?
Asset managers use ratio analysis to track performance trends, benchmark properties against competitive sets, and identify early signs of margin compression or liquidity stress. Done consistently, it shifts financial data from a reporting function into an active decision-making input.