
Introduction
A hotel is not a building with tenants. It's an operating business that resets its revenue every single day — and that distinction changes everything about how you value it.
Standard commercial real estate appraisal frameworks were built for leased assets with predictable, contractual income. Hotels don't work that way. Occupancy swings with seasons, events, and economic cycles. Labor costs shift with turnover. Brand relationships impose capital obligations.
A 10% drop in RevPAR can materially compress value even when the physical asset is unchanged. Ignoring that dynamic leads to costly misjudgments: overpaying on acquisition, underselling at disposition, or securing financing on shaky assumptions.
This guide is for hotel owners, developers, investors, lenders, and asset managers who need to understand how hotel valuation actually works. It covers:
- The three recognized valuation methods and when each applies
- Key factors that drive and erode hotel value
- The end-to-end valuation process
- Common mistakes that produce inaccurate outcomes — often at the worst possible moment
Key Takeaways
- Hotel valuation merges real estate appraisal with business performance analysis — asset and operations are inseparable
- Income Capitalization (DCF or direct cap rate) is the dominant method for income-producing hotel assets
- RevPAR, NOI, cap rate, location, brand, and physical condition are the primary measurable value drivers
- Professional valuation follows a structured workflow: data collection, normalization, method application, and reconciliation
- Critical errors include unadjusted financials, single-method reliance, and overlooked capital expenditure obligations
What Is Hotel Valuation?
Hotel valuation is the structured process of estimating the market or investment value of a hotel asset, accounting for both the physical real estate and the income-generating business operating within it.
Why Hotels Are Harder to Value
Unlike office or retail properties, hotels generate revenue through hundreds of daily transactions across multiple departments. As HVS describes it, hotels are retail-oriented, labor-intensive going concerns whose patronage can turn over every two to four days. That reality creates complexity that standard appraisal frameworks aren't designed to handle:
- Daily revenue fluctuation driven by occupancy and pricing decisions
- Labor intensity — hotel labor costs rose 4.8% in 2024 alone
- Brand dependencies that affect both revenue and cost structure
- Capital cycles tied to brand-mandated renovation requirements
- Seasonal and cyclical demand volatility across market types
Market Value vs. Investment Value
Most formal appraisals target market value — what a typical, well-informed buyer would pay under arm's-length conditions. Investor underwriting models focus on investment value — what the asset is worth to a specific buyer based on their return requirements, financing structure, and risk tolerance. Conflating the two is a common underwriting error — a seller relying on market value comps may be overpricing an asset for a buyer whose return threshold demands a significant discount.
The Three Main Hotel Valuation Methods
Professional hotel appraisers and investors apply three globally recognized methods — typically in combination. Each provides a different lens: income-based approaches focus on earning power, the sales comparison approach on market pricing, and the cost approach on replacement economics.
Income Capitalization is the industry-preferred method for operating hotels because it most closely reflects how sophisticated investors make acquisition decisions, prioritizing future income potential over book value or replacement cost.
Income Capitalization: Cap Rate and DCF
Direct Capitalization (Cap Rate)
The formula is straightforward: Hotel Value = NOI ÷ Cap Rate
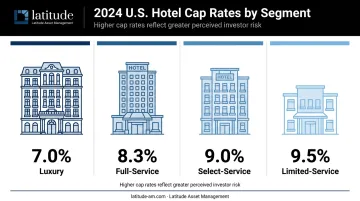
NOI is derived by subtracting operating expenses from total revenue, excluding debt service and taxes. The cap rate reflects both market conditions and asset-specific risk. According to HVS's 2024 analysis, current U.S. hotel cap rate point estimates by segment are:
| Hotel Segment | Cap Rate (2024) |
|---|---|
| Luxury | 7.0% |
| Full-Service | 8.3% |
| Select-Service | 9.0% |
| Limited-Service | 9.5% |
Geography matters considerably. CBRE's H2 2025 survey shows city-center, full-service branded hotels ranging from 5.25%–7.25% in New York and 6.50%–7.25% in Los Angeles — below national segment averages, reflecting lower perceived risk in high-demand urban markets.
Discounted Cash Flow (DCF)
DCF projects future NOI over a defined holding period — typically 10 years — discounts annual cash flows to present value using a risk-adjusted discount rate, and adds a terminal value representing the anticipated sale at the end of the hold period.
DCF is considered the most precise approach when assumptions are grounded in credible market data. Unlike a cap rate calculation, it can capture ramp-up periods, renovation cycles, and non-stabilized income patterns. HVS benchmarks overall discount rates at 9.6% for full-service/luxury and 10.6%–11.1% for select- and limited-service properties, though these move with capital market conditions.
The critical limitation of both approaches: outcomes are highly sensitive to input assumptions. A 50-basis-point shift in the terminal cap rate or discount rate can move value by millions. Every model should be stress-tested across at least three scenarios — base, upside, and downside — with explicit documentation of assumption sources.
Sales Comparison Approach
This method estimates value by comparing the subject hotel to recently completed transactions involving similar properties — same market, hotel class, brand tier, and room count. Common benchmarking metrics include price per key (sale price divided by room count) and price per square foot.
CoStar reported that U.S. single-asset hotel sales above $10M in Q1 2024 averaged $230,000 per key, though individual transactions vary enormously — the Arizona Biltmore sold in 2024 at $1M per key.
This method works best for standardized limited-service and select-service hotels in active transaction markets. Its primary limitation: hotel transaction data is often scarce, confidential, or difficult to normalize. Total U.S. hotel transaction volume was $21 billion in 2024, down 15% from 2023, further thinning the comparable pool.
Cost Approach
The cost approach estimates the current cost of replacing the hotel from scratch — land value plus construction costs plus soft costs — then subtracts depreciation from physical deterioration, functional obsolescence, and economic obsolescence.
This method is most relevant for newly built hotels, specialty properties, or markets with insufficient income or sales data. For established income-producing hotels, it carries the least weight, for three reasons:
- Ignores the hotel's actual earnings power and investor return expectations
- Cannot account for demand dynamics, brand strength, or management quality
- Depreciation estimates grow increasingly subjective as a building ages
Key Factors That Drive Hotel Value
Operational Performance and KPIs
RevPAR, ADR, occupancy, gross operating profit (GOP), and NOI are the most direct value drivers. A hotel with stronger, more stable financial performance commands a higher valuation and a more favorable cap rate.
One critical nuance: RevPAR growth doesn't automatically translate to NOI growth. CBRE's 2024 analysis found that U.S. hotels saw revenue grow 2.3% while above-GOP expenses grew 4.1% — meaning RevPAR gains were largely absorbed by rising costs, compressing margins. U.S. RevPAR grew 1.8% in 2024, almost entirely through 1.7% ADR growth. Investors underwriting to revenue growth alone will overestimate value.
Location and Demand Stability
Primary locations — urban centers, airport corridors, established leisure markets — support more predictable revenue streams, reduce investor risk perception, and compress cap rates. Secondary and tertiary markets may offer higher yield potential but carry greater volatility.
Location isn't just geography. It's the depth and diversity of local demand drivers: corporate accounts, group business, leisure travelers, and event calendars. A hotel serving a single employer or seasonal resort market carries concentration risk that a diversified urban demand base does not.
Brand Affiliation and Management Quality
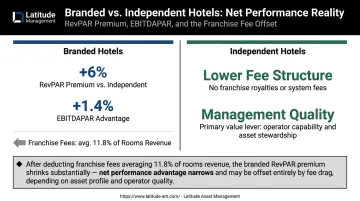
Brand affiliation is a financial equation, not just a marketing decision. A Cornell study covering 45,035 U.S. hotel property-years found branded hotels averaged 6% higher RevPAR than independents — but only 1.4% higher EBITDAPAR. The revenue premium shrinks significantly after accounting for franchise fees, which HVS estimates average 11.8% of rooms revenue.
Management quality compounds the effect in either direction. A well-managed independent can outvalue a poorly managed branded asset. Cost efficiency, revenue strategy execution, and staff retention are measurable — and they show up directly in NOI.
Physical Condition and CapEx Obligations
Deferred maintenance, aging FF&E, and pending Property Improvement Plan (PIP) requirements reduce value because buyers price in future capital outflows. A 2023 LODGING report documented 90%–300% price increases for select PIP product categories, particularly case goods.
During due diligence, PIP obligations are typically resolved through one of three mechanisms:
- Buyer credits: Purchase price adjusted to reflect the buyer's projected remediation cost
- Price reductions: Seller accepts a lower headline price in lieu of completing work
- Seller completion: Owner completes the PIP prior to close as a condition of sale
Owners who proactively maintain their assets preserve valuation optionality; those who defer maintenance hand buyers a negotiating lever.
Capital Market Conditions
Asset-level factors determine what a hotel can produce — but capital market conditions determine what that income stream is worth to a buyer. Rising interest rates push cap rates higher and reduce asset values even when operating performance is unchanged. In Q3 2023, the average U.S. hotel cap rate was 8.0% while the average hotel CMBS loan rate was 8.4%, effectively inverting the debt-to-cap rate spread and making leveraged acquisitions structurally difficult.
The same hotel can carry materially different valuations at different points in the market cycle, with no change in operations. This dynamic makes timing of acquisition and disposition decisions as important as the asset itself.
The Hotel Valuation Process: From Data to Decision
Professional hotel valuation is a structured, multi-step workflow — one where clean financial data, expert normalization, method selection, and defensible reconciliation each play a distinct role. The quality of the output depends on the quality of the inputs and the expertise of those applying the framework.
Advisors who combine institutional financial discipline with deep hotel operating knowledge are better positioned to ensure valuations reflect true asset potential. Latitude Asset Management's team includes Cornell-certified hotel investment professionals, a CFA charterholder, and operational leaders with decades of experience across Hyatt, Loews, and IHG — a background that informs every stage of the process below.
Step 1: Data Collection and Financial Organization
Minimum data requirements for a credible valuation:
- 2–3 years of profit and loss statements (by department)
- Revenue breakdowns: rooms, F&B, ancillary
- Historical occupancy and ADR data
- CapEx and FF&E reserve records
- Copies of management agreements, franchise contracts, and ground lease documents
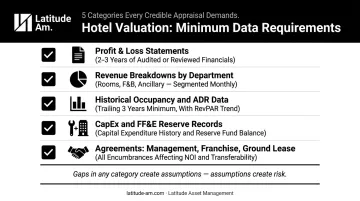
Gaps in any of these create assumptions — and assumptions create risk.
Step 2: Normalization and Stabilization
Raw financial statements are rarely valuation-ready. The purpose of normalization is to strip out one-time events — COVID disruption years, management transitions, unusual expense spikes — and adjust revenues to reflect sustainable operating conditions.
This normalized NOI becomes the foundation of any income-based valuation. Skipping it produces distorted outputs that lead directly to overpayment or underpricing — errors that are difficult to reverse once a transaction closes.
Step 3: Method Application and Sensitivity Testing
Once primary valuation methods are applied, sensitivity analysis tests how changes in key assumptions affect the value estimate. Variables typically tested include NOI growth rate, cap rate, discount rate, and occupancy trajectory.
Sensitivity analysis converts a single-point estimate into a defensible range and reveals which assumptions carry the most risk. Without it, the value conclusion rests on one scenario rather than a tested set of conditions — a meaningful distinction when presenting to lenders or investment committees.
Step 4: Reconciliation and Value Conclusion
The final step reconciles outputs from the methods applied, weighting each based on data quality, property characteristics, and market context. The value conclusion is then documented with clear explanation of assumptions, data sources, and methodology.
This documentation is essential — for lender review, investor due diligence, or regulatory compliance. Documentation is also where the valuation earns credibility: a number without a traceable rationale carries little weight in underwriting or dispute resolution.
Common Mistakes in Hotel Valuation
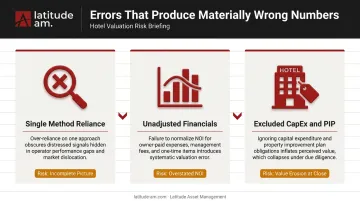
Three errors appear consistently enough to warrant direct attention — each capable of producing a materially wrong number.
Relying on a single valuation method. A cap rate in isolation misses distressed pricing signals; sales comparisons alone can overlook an earnings turnaround. Best practice is to triangulate across all three approaches, weighted by data quality and relevance to the asset.
Applying raw financial statements without normalization. Financials from years affected by renovation, ownership transitions, or external shocks produce distorted NOI — and unreliable value conclusions. This error affects both sides of the transaction: buyers overpay, sellers underprice.
Excluding CapEx, PIP, and deferred maintenance. Owners who omit anticipated capital requirements arrive at inflated value expectations that unravel during due diligence. Every valuation must account for the capital required to maintain or reposition the asset across the hold period.
CBRE measured a 5.0% increase in maintenance department costs in 2024, attributing part of the increase to deferred renovation projects. Those costs don't disappear — they accumulate until a transaction forces the conversation.
Hotel valuation is both a technical discipline and a judgment-driven process. The methods provide structure, but the accuracy and defensibility of the output depend on data quality, normalization rigor, and the expertise of those applying the framework. For high-stakes decisions, that expertise must span both financial performance and operational reality — a gap in either produces conclusions that won't hold up when it matters most.
Frequently Asked Questions
What are the main methods of hotel valuation?
The three globally recognized methods are the Income Capitalization Approach (using DCF or direct cap rate), the Sales Comparison Approach, and the Cost Approach. For operating hotels, the income approach is most widely preferred because it reflects income-generating potential rather than replacement cost or comparable pricing alone.
What is a good EBITDA for a hotel?
EBITDA margins vary significantly by segment and market. As a reference point, industry benchmarks for GOP margins — a closely related metric — run approximately 35%–40% for limited-service and 25%–35% for full-service hotels. In practice, EBITDA lands lower once management fees and reserve contributions are deducted.
How is hotel valuation different from a standard commercial real estate appraisal?
Hotel valuation must account for the operating business within the property. Unlike office or retail appraisals, hotel value is directly driven by daily income performance metrics — RevPAR, ADR, occupancy, and NOI — making operational expertise as important as real estate knowledge in producing a credible result.
What is a typical cap rate for hotels?
Hotel cap rates are generally higher than other commercial real estate sectors due to operational risk and cyclicality. HVS's 2024 estimates: 7.0% luxury, 8.3% full-service, 9.0% select-service, 9.5% limited-service. Stabilized urban assets typically trade at lower cap rates than value-add or secondary-market properties.
How often should a hotel owner revalue their property?
Annual revaluation makes sense for most owners, with additional reviews triggered by refinancing, brand change, renovation completion, or significant market shifts. Hotel values can move meaningfully without any operational change if capital market conditions shift — as 2023–2024 made clear.
What financial data is needed to begin a hotel valuation?
At minimum, a credible valuation requires:
- 2–3 years of profit and loss statements
- Revenue by department and historical occupancy and ADR data
- CapEx and FF&E reserve records
- Management and franchise agreement details affecting net income
Missing data forces assumptions, which reduces valuation reliability.